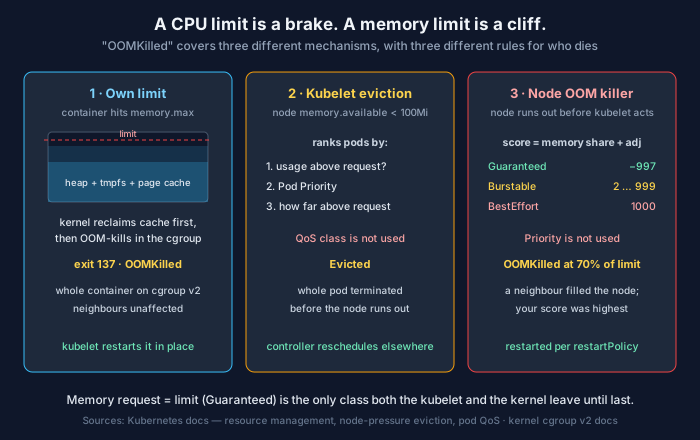
A few weeks ago I wrote about CPU limits throttling pods that look half idle. Memory is the other half of that story, and the failure mode is harsher. Exceed your CPU limit and the kernel slows you down. Exceed your memory limit and it kills you.
There’s no partial credit with memory. You can’t run a process at 80% of the RAM it needs. So the questions that matter are: what exactly counts against the limit, who pulls the trigger, and when the node gets tight, who goes first.
What a memory limit does
Kubernetes turns resources.limits.memory into memory.max on the container’s cgroup. The kernel’s cgroup v2 docs describe it as “the main mechanism to limit memory usage of a cgroup”, and spell out what happens at the edge: “If a cgroup’s memory usage reaches this limit and can’t be reduced, the OOM killer is invoked in the cgroup.”
Note and can’t be reduced. Before killing anything, the kernel tries to reclaim memory from the cgroup, mainly by dropping clean page cache. Only when reclaim fails does a process die. The Kubernetes docs call this out: “memory limits are enforced reactively. A container may use more memory than its memory limit, but if it does, it may get killed.”
When it happens, the container’s last state shows reason: OOMKilled and exit code 137, which is 128 plus signal 9, SIGKILL. No shutdown hook runs. No final log line gets flushed. The process is simply gone.
What counts against the limit
More than your heap.
- Anonymous memory: your heap, stacks, and anything allocated with
mallocormmap. This is the part you think of as “memory”. - Page cache: file data the kernel cached for reads and writes from this container. It’s charged to your cgroup and counts toward usage. Clean cache is reclaimable, so it rarely kills you on its own, but it makes raw usage numbers look alarming.
- tmpfs: a
medium: MemoryemptyDir lives in RAM. The docs are explicit that “the kubelet tracks tmpfs emptyDir volumes as container memory use, rather than as local ephemeral storage”, and without asizeLimitthe volume can grow up to the pod’s memory limit. A service that writes temporary files to a memory-backed volume is spending its memory limit on them. - Kernel memory charged to the cgroup, such as socket buffers and page tables. Usually small, occasionally not.
Because of page cache, raw usage (memory.current) overstates what matters. The kubelet and cAdvisor use the working set: usage minus inactive file-backed pages, which the kernel can drop without a fight. That’s the container_memory_working_set_bytes metric, and it’s the one to compare with your limit.
Three ways to die
People say “OOMKilled” for all of these. They’re different mechanisms, triggered by different conditions, with different rules for who gets picked.
1. The container hits its own limit. The kernel OOM-kills a process inside that container’s cgroup. Nothing else on the node is affected, and the kubelet restarts the container according to its restartPolicy. This is the common case, and it’s the easiest to reason about: the fix is either a bigger limit or less memory use.
2. The kubelet evicts the pod. The kubelet watches memory.available on the node, which is capacity minus the node’s working set. When it drops below the eviction threshold, memory.available<100Mi by default on Linux according to the node-pressure eviction docs, it terminates whole pods to recover memory. An evicted pod is not restarted on that node. Its controller creates a replacement, which gets scheduled wherever there’s room.
3. The kernel OOM killer picks a victim on the node. If memory runs out faster than the kubelet can react, which is entirely possible because the kubelet polls and allocations don’t wait, the node-level OOM killer steps in. It scores every process by how much of the node’s memory it uses and adds an oom_score_adj the kubelet set from the pod’s QoS class. The highest score dies. That can be a pod that was nowhere near its own limit.
Case three is how you get an OOMKilled container at 70% of its limit. It didn’t exceed anything. A neighbour pushed the node over, and the kernel’s scoring picked yours.
Who goes first
The two node-level mechanisms use different rules, and that surprises people.
The kubelet ranks pods by three things, in order: whether usage exceeds the request, then Pod Priority, then how far usage exceeds the request. The docs note that “the kubelet does not use the pod’s QoS class to determine the eviction order.”
The kernel doesn’t know what a pod or a priority is. It uses memory share plus oom_score_adj, and the kubelet sets that from QoS class: -997 for Guaranteed pods, 1000 for BestEffort, and for Burstable, min(max(2, 1000 - 1000 × request / node_memory), 999). A bigger request buys a lower score.
Here’s a small calculator that applies both sets of rules to the same node:
"""Who dies first when a Kubernetes node runs out of memory?

Two different mechanisms pick victims, using different rules:
  1. The kubelet's eviction manager, when memory.available drops below its
     threshold (default 100Mi on Linux). It ranks pods by: usage above request
     first, then Priority, then how far usage is above request.
  2. The kernel OOM killer, if memory runs out before the kubelet can act. It
     scores each process by its share of node memory (0-1000) plus the
     oom_score_adj the kubelet set from the pod's QoS class.

oom_score_adj values follow the Kubernetes docs (node-pressure eviction):
  Guaranteed -997 · BestEffort 1000 ·
  Burstable  min(max(2, 1000 - 1000 * request / node_capacity), 999)
The kernel score here is simplified to usage share; the real oom_badness also
counts swap and page tables.
"""
from dataclasses import dataclass

Gi = 1024 ** 3
NODE = 32 * Gi


@dataclass
class Pod:
    name: str
    request: int      # memory request, bytes (0 = none)
    limit: int        # memory limit, bytes (0 = none)
    usage: int        # working set, bytes
    priority: int = 0

    @property
    def qos(self):
        if self.request and self.request == self.limit:
            return "Guaranteed"          # (assumes CPU request == limit too)
        return "Burstable" if (self.request or self.limit) else "BestEffort"

    @property
    def oom_score_adj(self):
        if self.qos == "Guaranteed":
            return -997
        if self.qos == "BestEffort":
            return 1000
        return min(max(2, 1000 - (1000 * self.request) // NODE), 999)

    @property
    def oom_score(self):
        return max(0, min(2000, (1000 * self.usage) // NODE + self.oom_score_adj))


pods = [
    Pod("payments-api   ", request=4 * Gi, limit=4 * Gi, usage=int(3.8 * Gi), priority=1000),
    Pod("checkout-worker", request=2 * Gi, limit=12 * Gi, usage=int(9.5 * Gi), priority=1000),
    Pod("web-frontend   ", request=1 * Gi, limit=2 * Gi, usage=int(0.9 * Gi), priority=1000),
    Pod("report-cron    ", request=0, limit=0, usage=int(0.3 * Gi)),
    Pod("cache-warmer   ", request=6 * Gi, limit=8 * Gi, usage=int(7.5 * Gi)),
]

print(f"{'pod':16s} {'QoS':11s} {'req':>5s} {'use':>5s} {'adj':>5s} {'score*':>9s}")
for p in pods:
    print(f"{p.name} {p.qos:11s} {p.request / Gi:5.1f} {p.usage / Gi:5.1f} "
          f"{p.oom_score_adj:5d} {p.oom_score:9d}")


def eviction_key(p):
    over = p.usage > p.request
    return (not over, p.priority, -(p.usage - p.request))


print("\nkubelet eviction order:", " -> ".join(p.name.strip() for p in sorted(pods, key=eviction_key)))
print("kernel OOM kill order:  ", " -> ".join(p.name.strip() for p in sorted(pods, key=lambda p: -p.oom_score)))
pod QoS req use adj score*
payments-api Guaranteed 4.0 3.8 -997 0
checkout-worker Burstable 2.0 9.5 938 1234
web-frontend Burstable 1.0 0.9 969 997
report-cron BestEffort 0.0 0.3 1000 1009
cache-warmer Burstable 6.0 7.5 813 1047
kubelet eviction order: cache-warmer -> report-cron -> checkout-worker -> web-frontend -> payments-api
kernel OOM kill order: checkout-worker -> cache-warmer -> report-cron -> web-frontend -> payments-apiThe pod names are invented; the rules are from the docs. Three things to notice.
Priority protects you from the kubelet, not from the kernel. checkout-worker is high priority, so the kubelet evicts two low-priority pods before touching it. But it’s using 9.5 GiB against a 2 GiB request, and if the node runs out before the kubelet acts, the kernel kills it first. Priority means nothing to the OOM killer.
Guaranteed is the only real protection. payments-api is last in both orders. Its request equals its limit, so it’s never over its request, and its -997 adjustment makes it nearly unkillable at node level.
A small request is a large target. checkout-worker asked for 2 GiB and uses 9.5. Both mechanisms read that gap as “this pod is borrowing memory it was never promised”, and they’re right.
Requests do more than you think
For CPU, a request is a scheduling hint and a weight under contention. For memory, the request decides where the pod lands, where it ranks for eviction, and, for Burstable pods, its OOM score. It’s the single most important memory number you set, and it’s the one most often copied from a template.
Kubernetes has been working on making requests matter at runtime too. Memory QoS with cgroup v2, beta and on by default since v1.37, can set memory.high to throttle a Burstable container before it reaches its hard limit, and memory.min or memory.low to protect requested memory from reclaim. But the docs note that the default kubelet configuration enables neither: you have to set memoryThrottlingFactor or a reservation policy. Check your kubelet config before assuming you have it.
Make the runtime agree with the limit
Most runtimes size themselves from the memory they think they have, and the limit is the only number that matters.
- JVM: container-aware for years, with a default max heap of a quarter of the container’s memory. Set
-XX:MaxRAMPercentagedeliberately, and leave headroom for metaspace, thread stacks, direct buffers and the JIT, all of which live outside the heap and inside the limit. - Go: since Go 1.25,
GOMAXPROCSfollows the container’s CPU limit, butGOMEMLIMITstill defaults to no limit. There’s a proposal to derive it from the cgroup; until your Go version does that, setGOMEMLIMIT(Go 1.19+) somewhat below the container limit so the GC works harder as memory gets tight, instead of letting the heap grow straight into the OOM killer. - Python and anything else without a heap cap: watch worker counts. A pre-forking server with workers sized from the node’s core count multiplies your per-worker memory by a number unrelated to the limit.
And check the units. Kubernetes accepts m as a suffix for memory, and it means millibytes. The docs call this out directly: a request of 400m is “a request for 0.4 bytes”. You meant 400Mi.
Metrics to put on the dashboard
Working set against the limit, per container, as a ratio:
max by (namespace, pod, container) (container_memory_working_set_bytes{container!=""})
/
max by (namespace, pod, container) (kube_pod_container_resource_limits{resource="memory"})
And the kills themselves, from kube-state-metrics:
sum by (namespace, pod, container) (
  kube_pod_container_status_last_terminated_reason{reason="OOMKilled"}
)
Inside a container on cgroup v2, /sys/fs/cgroup/memory.events has an oom_kill counter, the number of processes in that cgroup killed by any OOM killer.
One behaviour change worth knowing: on cgroup v2 nodes, the kubelet sets memory.oom.group on each container’s cgroup (the default since Kubernetes 1.28), so an OOM in any process kills every process in the container together. Under cgroup v1, the kernel killed just one process, often a worker that the parent quietly respawned. If you run a pre-forking server or a sidecar-style supervisor, an OOM now takes the whole container down. The Kubernetes blog on the cgroup v2 shift covers the singleProcessOOMKill kubelet setting (added in 1.32) that restores the old behaviour, if you really want it.
Alert on the working-set ratio at, say, 90% sustained. Unlike CPU, there’s no gentle degradation to warn you. The step after 100% is a kill.
A checklist
- Set memory request equal to limit for anything user-facing. Guaranteed is the only class both the kubelet and the kernel leave until last.
- Size the limit from peak working set, not the average, plus headroom for everything outside the heap.
- Set the runtime’s memory ceiling below the limit:
MaxRAMPercentage,GOMEMLIMIT, worker counts. - Put a
sizeLimiton every memory-backed emptyDir, and count it in the limit. - Alert on working set / limit, and on OOMKilled. Graph them next to restarts.
- Know who goes first on each node. Burstable pods running far over their requests are your node-level victims, whatever their priority.
CPU limits are a brake. Memory limits are a cliff. Set them like it.
Related: Your Pod Uses Half Its CPU Limit and Still Gets Throttled · What a Container Actually Is: Namespaces, cgroups, and Layers · Virtual Memory and Paging · Garbage Collection: The Convenience That Shows Up in Your p99
Comments