Here’s a story that plays out, in some form, at a lot of companies running services on Kubernetes. Call it a composite; the details change, the arithmetic doesn’t.
The ORM ships with a default pool of 10 or 20 connections. The service has 10 replicas, so it uses 200 connections, and the database allows 100 by default, so someone raises max_connections to 500 and moves on. Six months later the service autoscales to 40 replicas during a traffic spike, asks for 800 connections, and starts logging FATAL: sorry, too many clients already. Someone raises the limit again.
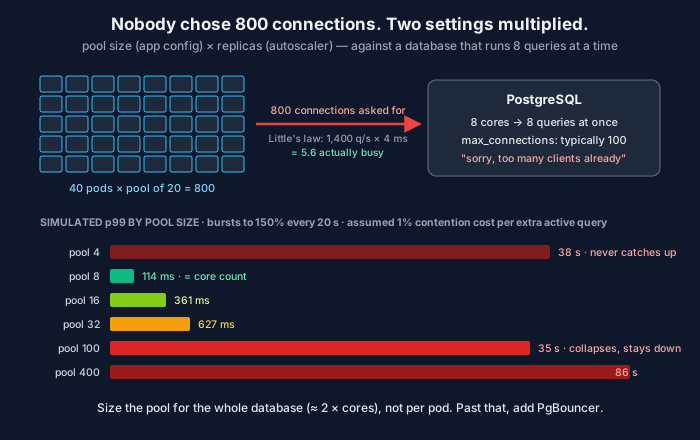
Nobody chose 800. It’s the product of two settings owned by two different people: pool size, in an application config file, and replica count, in an autoscaler. The database has 8 cores. It can actually run 8 queries at a time.
How many connections do you actually use?
Little’s law answers this in one line: the average number of things in a system equals arrival rate times time spent in the system. For a database pool, that’s
busy connections = queries per second × average query time
A service doing 1,400 queries per second at 4 ms each keeps 5.6 connections busy on average. Not 200. Not 800. Even during a burst to twice the traffic, it needs about a dozen.
Every other connection in the pool sits idle, holding a Postgres backend process and its memory, doing nothing until a burst arrives. Then they all wake up at once, and that’s where the trouble starts.
Why a bigger pool is slower
A database with 8 cores can execute 8 queries in parallel. Give it 100 active queries and it doesn’t do 100 things at once; it time-slices between them, so each one takes longer. Worse, the overhead isn’t free. Lock contention, context switches and CPU cache misses grow with the number of active queries and eat into the CPU that should be doing useful work.
The HikariCP pool sizing guide puts it in one sentence: “You want a small pool, saturated with threads waiting for connections.” Waiting in the application’s pool queue is cheap. Waiting inside the database, competing for its CPU, slows everyone down at once.
Here’s a simulation. An 8-core database, queries that need 4 ms of CPU, 1,400 queries per second, with a 2-second burst to 2,100 per second every 20 seconds. Queries that can’t get a connection wait in the app. One modelling assumption, stated up front: each active query beyond the core count costs 1% of the server’s throughput in contention. That number is made up. Real databases vary a lot, which is why the script also runs with zero contention cost.
"""Connection pool size vs. a database with 8 cores, simulated in 0.5 ms ticks.

Each query needs 4 ms of CPU. Queries arrive at 1,400/s (70% utilisation), with
a 2-second burst at 2,100/s every 20 seconds. A query that can't get a
connection waits in the application's pool queue.

Contention model (an assumption, not a measurement): when more queries are
active than there are cores, the server time-slices them, and each extra active
query beyond the core count costs 1% of total throughput in lock contention,
context switches and cache misses.
"""
import random
from collections import deque

CORES, CPU_MS, BASE_RATE, BURST_RATE, TICK, SECONDS = 8, 4.0, 1400, 2100, 0.5, 120
PENALTY = 0.01


def run(pool, penalty=PENALTY, seed=3):
    rnd = random.Random(seed)
    waiting, active, lat = deque(), [], []        # active: [arrival_ms, cpu_left]
    for i in range(int(SECONDS * 1000 / TICK)):
        now = i * TICK
        rate = BURST_RATE if (now % 20000) < 2000 else BASE_RATE
        # Poisson arrivals this tick
        n, p = 0, rnd.random()
        lam = rate * TICK / 1000
        while p > 2.718281828 ** -lam:
            n += 1
            p *= rnd.random()
        waiting.extend([now] * n)
        while waiting and len(active) < pool:
            active.append([waiting.popleft(), CPU_MS])
        k = len(active)
        if k:
            capacity = CORES / (1 + penalty * max(0, k - CORES))   # CPUs of useful work
            share = min(1.0, capacity / k) * TICK
            for q in active:
                q[1] -= share
            done = [q for q in active if q[1] <= 0]
            for q in done:
                active.remove(q)
                lat.append(now + TICK - q[0])
    lat.sort()
    pct = lambda x: lat[int(len(lat) * x) - 1]
    backlog = len(waiting) + len(active)
    return (f"pool {pool:4d} | completed {len(lat):6d} | p50 {pct(.5):6.1f} ms | "
            f"p99 {pct(.99):7.1f} ms | p99.9 {pct(.999):7.1f} ms | left in flight {backlog}")


for size in (4, 8, 16, 32, 100, 400):
    print(run(size))
print("-- same, with zero contention cost (pure time-slicing) --")
for size in (8, 100, 400):
    print(run(size, penalty=0.0))
pool 4 | completed 119996 | p50 19292.5 ms | p99 38241.5 ms | p99.9 38828.5 ms | left in flight 56482
pool 8 | completed 176470 | p50 4.0 ms | p99 114.0 ms | p99.9 140.0 ms | left in flight 8
pool 16 | completed 176469 | p50 4.5 ms | p99 361.0 ms | p99.9 399.0 ms | left in flight 9
pool 32 | completed 176469 | p50 5.5 ms | p99 627.0 ms | p99.9 666.5 ms | left in flight 9
pool 100 | completed 124983 | p50 18099.0 ms | p99 35439.5 ms | p99.9 35720.5 ms | left in flight 51495
pool 400 | completed 48634 | p50 43868.0 ms | p99 86029.5 ms | p99.9 86893.0 ms | left in flight 127844
-- same, with zero contention cost (pure time-slicing) --
pool 8 | completed 176470 | p50 4.0 ms | p99 114.0 ms | p99.9 140.0 ms | left in flight 8
pool 100 | completed 176469 | p50 4.5 ms | p99 142.0 ms | p99.9 166.5 ms | left in flight 9
pool 400 | completed 176469 | p50 4.5 ms | p99 215.5 ms | p99.9 244.0 ms | left in flight 9Read it top to bottom.
Too small is bad too. A pool of 4 can only push 1,000 queries per second through 4 ms queries. Traffic is 1,400. It never catches up. The right size isn’t “as small as possible”; it’s “enough for the peak, and no more than the database can run at once”.
8 is the sweet spot here, and it equals the core count. Bursts queue briefly in the app and drain in about 100 ms.
16 and 32 still work, but the tail gets steadily worse. Same throughput, longer p99, because during a burst every query competes inside the database instead of waiting its turn outside it.
100 and 400 fall over and don’t get up. This is the part that matters. During a burst, all 100 connections go active, contention eats into throughput, and the database now completes fewer queries per second than arrive, even at normal traffic. The backlog keeps every connection busy, which keeps contention high, which keeps throughput low. The burst ends and the system stays broken. That’s a metastable failure, and it’s exactly what “the database got slow and never recovered until we restarted the app” looks like from the outside.
Even with zero contention cost, bigger is worse at the tail. Pure time-slicing alone takes p99 from 114 ms to 215 ms between 8 and 400 connections. The contention penalty decides whether a big pool is merely slower or catastrophic; it never makes it faster.
Sizing it for real
Start with the formula HikariCP quotes from the PostgreSQL community:
connections = (core_count × 2) + effective_spindle_count
with core count excluding hyperthreads, and spindle count zero if your working set fits in memory. For an 8-core database with everything cached, that’s 16. Then check it against Little’s law for your peak traffic, and load test around that number. HikariCP’s own caveat applies: “Pool sizing is ultimately very specific to deployments.”
The crucial step most teams skip: that number is for the whole database, not per pod. Divide it across every client:
"""Per-pod pool size from a database-wide connection budget."""
import math

def per_pod_pool(db_budget, max_replicas, services=1, reserve=0.2):
    """db_budget: connections the database should actually run (e.g. 2 x cores).
    reserve: fraction held back for migrations, admin, cron, and humans."""
    usable = math.floor(db_budget * (1 - reserve))
    return max(1, usable // (max_replicas * services))

print(per_pod_pool(db_budget=16, max_replicas=40))            # -> 1
print(per_pod_pool(db_budget=16, max_replicas=10))            # -> 1
print(per_pod_pool(db_budget=64, max_replicas=10, services=2))  # -> 2
1
1
2A pool of one connection per pod looks absurd, and that’s the point. Once you have more than a handful of replicas, direct per-pod pools can’t be sized correctly at all: either each pod gets a uselessly small pool, or the total blows through what the database can run. That’s the signal you need a pooler in the middle.
PgBouncer, and what it costs you
PgBouncer sits between your pods and Postgres. Each pod can open as many client connections as it likes; PgBouncer maps them onto a small, fixed number of real server connections. The setting that matters is the pool mode:
- Session pooling assigns a server connection for as long as the client stays connected. Safe, and it multiplexes almost nothing while your pods hold connections open.
- Transaction pooling assigns a server connection only for the duration of a transaction. This is the mode that turns 800 client connections into 16 server connections.
Transaction mode has a price. Between transactions, your next query may land on a different server connection, so session state doesn’t follow you. PgBouncer documents that SET/RESET, LISTEN, WITH HOLD cursors, SQL-level PREPARE/DEALLOCATE and session-level advisory locks are never supported in transaction mode. Protocol-level prepared statements, which many drivers use under the hood, do work, but only after you set max_prepared_statements to a non-zero value.
Before switching, grep your code for SET statements, LISTEN, and pg_advisory_lock. If you rely on advisory locks for leader election, move them to a direct connection or to transaction-scoped pg_advisory_xact_lock.
Raising max_connections is the wrong fix
The PostgreSQL docs give max_connections a default of typically 100, settable only at server start, with three of those slots reserved for superusers. When you hit it, raising it feels like the fix. But every Postgres connection is a separate backend process. Raising the limit doesn’t add cores. It raises the ceiling on how badly the database can overload itself, which is the 100 and 400 rows above.
Treat max_connections as a circuit breaker, not a capacity setting. It’s the thing that stops a misconfigured autoscaler from turning a traffic spike into a database meltdown. If you keep hitting it, the fix is upstream: smaller pools, or a pooler.
A checklist
- Compute your total: pool size × max replicas, summed across every service that talks to the database. Compare it with the core count, not with
max_connections. - Measure busy connections, not open ones. In Postgres, count
pg_stat_activityrows withstate = 'active'and graph it. That’s your real concurrency, and Little’s law should predict it. - Size the database-wide budget around 2× cores, then load test.
- If per-pod pools come out below 2–3 connections, put PgBouncer in transaction mode in front, and audit for session state first.
- Set a pool acquire timeout shorter than your request deadline, so a saturated pool fails fast instead of piling up waiting requests.
- Leave
max_connectionsalone, unless you’ve done the math and know why.
Your database doesn’t need more connections. It needs fewer things trying to run on it at once.
Related: Queueing Theory for SREs: Little’s Law and the Utilisation Knee · Cascading Failure: Backpressure, Load Shedding, and Graceful Degradation · Percentiles, Properly: You Cannot Average a p99
Comments