The pattern goes like this. A service has a p99 problem. Someone opens the dashboard and CPU sits at around half the limit, so CPU gets ruled out and the investigation moves on to the database, the network, the garbage collector. A week later someone finds the throttling metric, and it’s been climbing the whole time.
The confusion comes from one detail: a Kubernetes CPU limit isn’t a limit on average usage. It’s enforced in 100 millisecond slices, and your dashboard averages over minutes.
What a CPU limit actually does
Kubernetes turns resources.limits.cpu into a CFS bandwidth quota on the container’s cgroup. On cgroup v2 you can read it directly:
$ cat /sys/fs/cgroup/cpu.max
200000 100000
That’s a limit of 2: 200,000 microseconds of CPU time per 100,000-microsecond period. The quota is shared by every thread in the container. When it runs out, the kernel stops scheduling all of them until the next period begins.
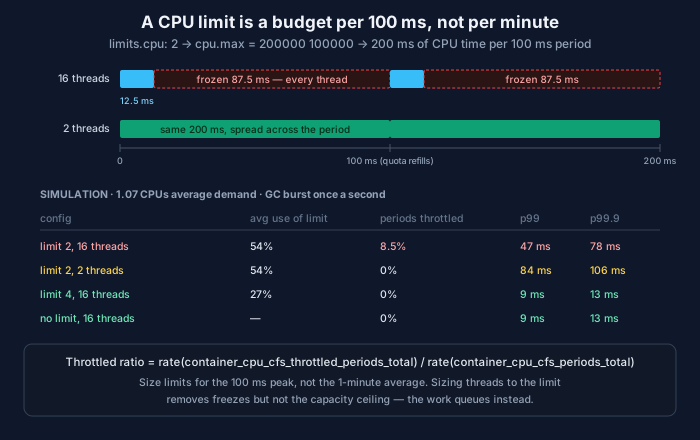
Now give that container 16 runnable threads, which is what you get from a runtime that sizes its thread pools to the node’s core count. Sixteen threads spend 200 ms of CPU time in 12.5 ms of wall-clock time. For the remaining 87.5 ms of the period, nothing in the container runs. Any request in flight just stops, however cheap it was.
Averaged over a minute, that container might look half idle. Its requests don’t experience the average. They experience the freeze.
Requests work completely differently, and this is where people’s mental model often goes wrong. resources.requests.cpu becomes a relative weight (cpu.weight on cgroup v2) that only matters when the node’s CPU is contended. A request never stops a container from using idle CPU. A limit always does.
A simulation
Here’s a toy model in 1 ms ticks. Requests arrive at 40 per second, and each fans out into four parallel tasks of 6 ms of CPU. Once a second the runtime’s garbage collector needs 120 ms of CPU and uses every thread it has. That’s about 1.08 CPUs of average demand.
"""CFS bandwidth control, simulated in 1 ms ticks.

Each request fans out into 4 parallel tasks of 6 ms CPU each (24 ms total),
at 40 requests/s. Every second the runtime's garbage collector needs 120 ms of
CPU and uses every thread it has. Average demand: about 1.08 CPUs.

With a CPU limit of 2, the kernel grants 200 ms of CPU per 100 ms period and
freezes every thread in the container once that's spent.
"""
import random

PERIOD, SECONDS, RATE, FANOUT, TASK_MS, GC_MS = 100, 600, 40, 4, 6, 120


def run(limit, threads, seed=11):
    rnd = random.Random(seed)
    quota = None if limit is None else limit * PERIOD
    tasks, pending, latencies = [], {}, []   # tasks: [req_id, cpu_ms_left]
    gc_left = used = throttled = 0
    left, hit_quota, rid = quota, False, 0
    for t in range(SECONDS * 1000):
        if t % PERIOD == 0:
            throttled += hit_quota
            left, hit_quota = quota, False
        if t % 1000 == 0:
            gc_left += GC_MS
        if rnd.random() < RATE / 1000:
            pending[rid] = [t, FANOUT]
            tasks += [[rid, TASK_MS] for _ in range(FANOUT)]
            rid += 1
        # GC gets the threads first; whatever's free runs request tasks
        gc_threads = min(threads, gc_left)
        task_threads = min(threads - gc_threads, len(tasks))
        want = gc_threads + task_threads
        if quota is not None and want > left:
            hit_quota = True
            gc_threads = min(gc_threads, left)
            task_threads = min(task_threads, left - gc_threads)
        if quota is not None:
            left -= gc_threads + task_threads
        gc_left -= gc_threads
        used += gc_threads + task_threads
        for task in tasks[:task_threads]:
            task[1] -= 1
        for task in [x for x in tasks[:task_threads] if x[1] == 0]:
            tasks.remove(task)
            pending[task[0]][1] -= 1
            if pending[task[0]][1] == 0:
                latencies.append(t + 1 - pending.pop(task[0])[0])
    latencies.sort()
    pct = lambda p: latencies[int(len(latencies) * p) - 1]
    cap = limit or threads
    return (f"avg {used / (SECONDS * 1000):.2f} CPUs ({used / (SECONDS * 1000) / cap:3.0%} of {cap:2d}) | "
            f"throttled periods {throttled / (SECONDS * 10):5.1%} | "
            f"p50 {pct(.50):3d} ms  p99 {pct(.99):3d} ms  p99.9 {pct(.999):3d} ms")


print("limit 2, 16 threads:", run(2, 16))
print("limit 2,  2 threads:", run(2, 2))
print("limit 4, 16 threads:", run(4, 16))
print("no limit,16 threads:", run(None, 16))
limit 2, 16 threads: avg 1.07 CPUs (54% of 2) | throttled periods 8.5% | p50 6 ms p99 47 ms p99.9 78 ms
limit 2, 2 threads: avg 1.07 CPUs (54% of 2) | throttled periods 0.0% | p50 14 ms p99 84 ms p99.9 106 ms
limit 4, 16 threads: avg 1.07 CPUs (27% of 4) | throttled periods 0.0% | p50 6 ms p99 9 ms p99.9 13 ms
no limit,16 threads: avg 1.07 CPUs ( 7% of 16) | throttled periods 0.0% | p50 6 ms p99 9 ms p99.9 13 msIt’s a model, so look at the shape rather than the exact milliseconds. Three things stand out.
Row one is the dashboard trap. Average usage is 54% of the limit, and 8.5% of periods are still throttled. The p99 is five times what it would be without the limit. Mostly that’s the GC burst draining the quota, and every request caught in the same period stalling behind it.
Row two is the surprise. Sizing the runtime to the limit (two threads for two CPUs) eliminates throttling completely, and the p99 gets worse. Throttling was never the root problem; two CPUs of capacity was. With fewer threads, the work that used to be frozen now waits in a queue instead. Matching the runtime to the limit is still the right thing to do, because it turns unpredictable freezes into ordinary queueing you can reason about. But it doesn’t create capacity.
Rows three and four are the same. At this load, a limit of 4 behaves like no limit at all, because it covers the bursts. The limit needs to be sized for peak parallel demand inside a 100 ms window, not for average demand over a minute.
The metric that shows it
Your CPU usage graph won’t show throttling. These will.
Inside the container, on cgroup v2:
$ cat /sys/fs/cgroup/cpu.stat
usage_usec 8812043921
user_usec 7920456102
system_usec 891587819
nr_periods 6048211
nr_throttled 514087
throttled_usec 21093325870
...
(Illustrative numbers.) nr_throttled / nr_periods is the fraction of periods in which the quota ran out, and throttled_usec is total time spent frozen.
Across a cluster, from cAdvisor’s metrics:
sum by (namespace, pod, container) (
  rate(container_cpu_cfs_throttled_periods_total{container!=""}[5m])
)
/
sum by (namespace, pod, container) (
  rate(container_cpu_cfs_periods_total{container!=""}[5m])
)
Put that on the same dashboard as your latency SLO, not on a separate “resources” page nobody opens during an incident. If p99 moves with throttling, you’ve found it. A few percent of periods throttled is enough to show up in tail percentiles, because the requests that land in a frozen period are exactly the ones that make up the tail.
Your runtime may not know about the limit
Throttling gets dramatically worse when the runtime thinks it has the whole node. If a container with a 2-CPU limit runs on a 64-core machine and its runtime sizes thread pools to 64, it can spend a period’s quota in about 3 ms.
Runtimes have been catching up. Since Go 1.25, the default GOMAXPROCS on Linux follows the container’s CPU limit when it’s lower than the core count, rounding fractional limits up, and the runtime re-checks periodically if the limit changes. It ignores requests, which is the right call: the request isn’t a ceiling. Older Go binaries default to the full core count, so check what version your images are actually built with.
The JVM has been container-aware since JDK 10 (backported to 8u191), but people override it with explicit flags more often than they realize. Python’s os.cpu_count() reports the host’s cores, so pool sizes derived from it, in concurrent.futures, multiprocessing and many worker-count formulas, can easily be oversized inside a small container. Set worker counts explicitly from the limit.
Remember row two of the simulation, though. Right-sizing the runtime trades freezes for queueing. It makes behaviour predictable; it doesn’t make the container bigger.
Should you remove CPU limits?
This is a genuine debate in the Kubernetes world, and I don’t think there’s one answer for every workload.
The case for removing them. Without a limit, a container can burst into idle CPU on the node, and throttling disappears. Requests still guarantee every container its proportional share when the node is busy, because that’s what cpu.weight is for. For latency-sensitive services with accurate requests, this usually gives the best tail latency per dollar. Rows three and four of the simulation are basically this argument.
The case for keeping them. Without limits, performance depends on your neighbours. A service that’s fast in staging because the node is idle can get slower in production for reasons no one on the team controls, which makes capacity planning and load tests less trustworthy. A runaway process can take far more than its share of an idle node. And the Guaranteed QoS class, plus the static CPU manager’s exclusive cores, requires CPU limits equal to requests.
Where I land:
- Always set accurate CPU requests. They drive scheduling and fairness under contention. Without them, removing limits is just hoping.
- Keep memory limits everywhere. Memory isn’t compressible. Running out of it means an OOM kill, not a slowdown, and the limit is how you contain it.
- For latency-sensitive services, try no CPU limit, with requests sized to realistic peak, and watch the latency SLO. If you need predictability more than burst, use Guaranteed QoS with limit equal to request, and size it for the 100 ms peak.
- For batch and background work, keep limits. Nobody’s p99 depends on it, and protecting neighbours matters more.
- Whatever you choose, chart throttling next to latency, and make sure the runtime knows the limit.
A checklist
- Add the throttled-periods ratio to every service dashboard, next to p99.
- Find containers with more than 1–2% of periods throttled and an average usage under 60% of the limit. Those are your hidden limit problems.
- Check how each runtime sizes its threads: Go version, JVM flags, Python worker counts.
- Resize limits for burst, or drop CPU limits on latency-critical services with good requests, and measure.
- Leave memory limits alone.
The graph that says “54% of limit” isn’t lying. It’s just answering a question about minutes, when the kernel enforces in tenths of a second.
Related: What a Container Actually Is: Namespaces, cgroups, and Layers · Percentiles, Properly: You Cannot Average a p99 · Queueing Theory for SREs: Little’s Law and the Utilisation Knee
Comments