Start at the roots, follow every reference. Whatever you can’t reach is garbage — even if it points at itself.
Garbage collection is one of the great quality-of-life improvements in programming: you allocate memory and simply never think about freeing it. But “never think about it” is a comfortable half-truth. The garbage collector is a real program doing real work at real times, and one of those times might be right in the middle of serving a latency-critical request. Understanding how GC works turns “our p99 latency has mysterious spikes” from a haunting into a tunable engineering problem. This is that refresher.
What “garbage” actually means
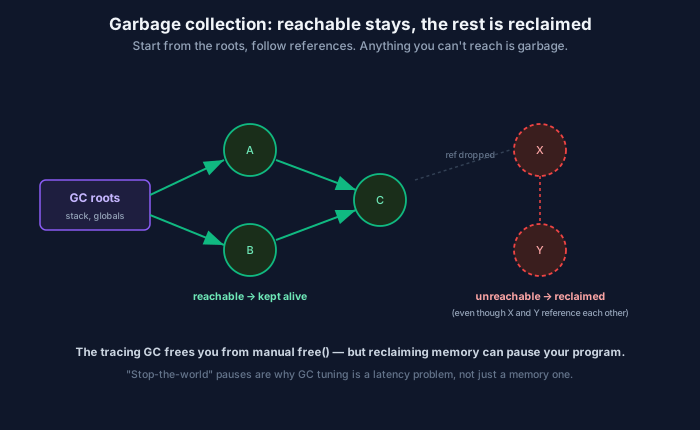
The core question a garbage collector answers is: which objects can be freed? The answer is elegantly simple — an object is still needed if and only if it’s reachable. The GC starts from a set of roots (local variables on the stack, global variables, CPU registers) and traces every reference outward. Anything it can reach is live and must be kept. Anything it can’t reach is garbage, because no code has any way to refer to it anymore, so it can be safely reclaimed.
The diagram shows the key insight. Objects A, B, and C are reachable from the roots — kept. Objects X and Y are unreachable — reclaimed — even though X and Y still reference each other. This is why proper tracing GC beats naive reference counting: reference counting frees an object when its count hits zero, but X and Y each keep the other’s count at one, so they’d leak forever. Reachability handles those cycles correctly. (Python actually uses reference counting plus a cycle detector for exactly this reason.)
Generational GC: the bet that most objects die young
Tracing the entire heap on every collection would be brutally expensive. Real collectors exploit an empirical observation called the generational hypothesis: most objects die young. The temporary string you built to format a log line, the intermediate list in a comprehension — the overwhelming majority of allocations become garbage almost immediately, while the few that survive (long-lived caches, connection pools) tend to survive a long time.
So generational collectors split the heap into a young generation and an old generation. New objects go in the young gen, which is collected frequently and cheaply (it’s small and mostly garbage). The rare survivors get promoted to the old gen, which is collected far less often. This makes the common case fast — you’re usually only scanning a small, short-lived nursery. It’s the same “exploit the skew in the workload” logic behind caching, applied to memory.
The catch: stop-the-world pauses
Here’s the part that shows up in production. To safely reclaim memory, the collector often needs a consistent view of the object graph — and the easiest way to get that is to pause the application while it works. This is a stop-the-world (STW) pause: your program freezes, serves no requests, and does nothing until the GC finishes. For a young-gen collection this might be sub-millisecond. For a full old-gen collection on a large heap, older collectors could pause for hundreds of milliseconds or more.
That pause is invisible in your average latency and glaring in your tail. It’s the classic cause of “our service is fast except for occasional unexplained spikes” — the spikes line up with GC pauses. This is why so much engineering has gone into low-pause collectors (the JVM’s G1, ZGC, and Shenandoah; Go’s concurrent collector) that do most of their work concurrently with the application, trading some throughput and CPU for dramatically shorter pauses. GC tuning, in practice, is almost always a latency decision — throughput vs pause time vs memory footprint — not a “do we leak?” decision.
The AI/cloud relevance
Your AI services are still built on managed runtimes. The API gateways, orchestration layers, MCP servers, and control planes wrapped around your models are usually written in GC’d languages — Java, Go, C#, Node, Python. When someone reports that inference tail latency has spikes the model can’t explain, GC pauses in the serving layer are a prime suspect. The model did its work in 200ms; the Java gateway in front of it stopped the world for 120ms at the wrong moment.
High allocation rates make GC bite harder. Request-heavy services that allocate a lot of short-lived objects per request (parsing JSON, building response payloads, marshalling tokens) drive frequent young-gen collections. Under load, allocation pressure rises, collections get more frequent, and the GC-induced tail gets worse exactly when you’re busiest — the same “only fails under load” shape we saw with race conditions, from a different cause.
It shapes language choice for latency-critical paths. This is a real reason parts of the infrastructure world reach for Rust (no GC, no pauses) or carefully tuned Go (concurrent, low-pause GC) for the hottest paths. And it’s why Python’s memory behavior — reference counting plus cycle detection — matters when a long-running inference worker slowly grows its footprint: a reference cycle holding onto big tensors is a leak the cycle collector should catch, unless something (a stray global, a caching decorator) keeps it reachable.
The takeaway
Garbage collection removes an entire category of bugs (use-after-free, double-free, most leaks) and hands you a different one: the collector runs on its own schedule, and its pauses land in your tail latency. The mental model — reachability from roots decides what’s garbage, generational collection makes the common case cheap, and stop-the-world pauses are the price — is enough to recognize GC in a latency graph and reach for the right knob. Automatic memory management isn’t free; it’s convenient, and the bill arrives at p99. Knowing that is the difference between blaming the model and fixing the runtime.
Comments