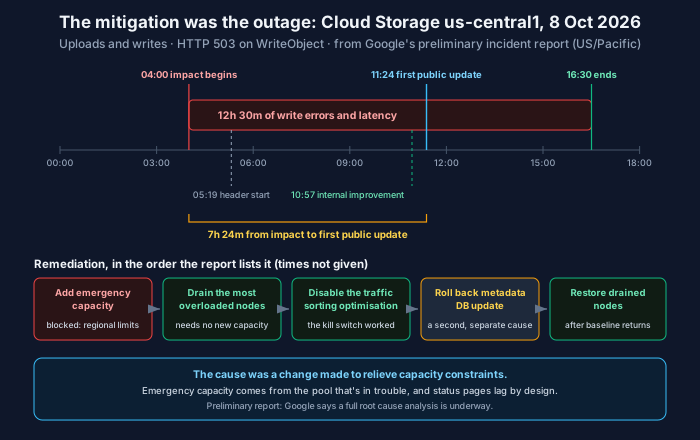
Last Thursday, Google Cloud Storage in us-central1 spent twelve and a half hours failing writes. On Friday morning Google posted a preliminary incident report. It’s short and it isn’t final, but three sentences in it deserve more attention than the outage itself got.
What follows is a reading of a preliminary report. Google says plainly that it reflects its best knowledge at the time of posting and that a full root cause analysis is still underway. Where I’m inferring rather than reporting, I’ll say so.
What the report says
Customer impact, in Google’s words: customers in us-central1 “primarily observed HTTP 503 UNAVAILABLE errors on WriteObject operations” along with client-side timeouts, from 04:00 to 16:30 US/Pacific. Reads saw minor impact. Other regions and services weren’t affected.
The preliminary root cause has two parts:
- A traffic sorting optimisation, intended to address localised capacity constraints, caused severe resource exhaustion on specific storage backend nodes in the region. The services handling object ingestion timed out, so uploads and writes routed to those nodes were delayed or failed.
- Separately, an issue with the underlying database service caused metadata processing errors for part of the window.
And the remediation, in order:
- Engineers tried to allocate emergency capacity to the region. That was “blocked by systemic regional capacity limits.”
- They drained traffic from the most overloaded storage nodes.
- A configuration change disabled the traffic sorting optimisation.
- A recent update to the metadata database service was rolled back.
- Drained nodes were restored once utilisation returned to baseline.
| Time (US/Pacific, 8 Oct) | Event | Source |
|---|---|---|
| 04:00 | Impact begins | Preliminary report |
| 05:19 | Start time shown in the incident header | Incident page |
| 10:57 | Improvement begins in Google’s internal monitoring | 11:55 update |
| 11:24 | First public status update | Incident page |
| 16:30 | Impact ends | Preliminary report |
| 09:44, 9 Oct | Preliminary incident report posted | Incident page |
The report doesn’t explain the gap between the 04:00 start and the 05:19 header time. I’ve used the report’s figure for duration.
The mitigation was the outage
Read the first root-cause sentence again. The thing that caused the incident was a change made to address capacity constraints. A fix for one capacity problem created a worse one.
Google hasn’t described how the sorting worked, so the mechanism here is my inference: an optimisation that steers traffic to relieve some nodes concentrates it on others, and if the receiving nodes are close to their own limits, you’ve converted a localised constraint into a localised exhaustion. That’s the general shape of load-steering failures, and it’s why “move the load somewhere better” needs the same guardrails as any other change — arguably more, because it acts on exactly the nodes that are already stressed.
This pattern deserves its own name in your change process. Performance optimisations and capacity tweaks tend to get less scrutiny than features. They’re “just tuning.” They often go out as configuration rather than code, which in many organisations means a lighter review path. And they’re frequently made during a period of stress, when the pressure to do something is highest and the margin for error is lowest. I’ve argued before that config changes still cause the biggest outages; this is a specific, nasty subclass of them.
There’s good news in the remediation list, too. Step 3 is “a configuration change was deployed to disable the traffic sorting optimisation.” The optimisation had an off switch, and the off switch worked. That’s the thing to copy. Every load-steering or capacity optimisation should ship with:
- a kill switch that is itself low-risk to flip,
- a canary scoped to a subset of nodes or cells, not the whole region,
- saturation signals on the receiving nodes, not just the ones being relieved, because the receivers are where this kind of change fails.
What the preliminary report doesn’t tell us is how long it took to decide to flip the switch. That’s the number I’d most want from the final report, because it’s usually where the hours go.
Emergency capacity comes from the pool that’s in trouble
Step 1 of the remediation is the sentence I’d put in front of anyone writing a disaster recovery plan. Google — the operator of the region, with every lever available — tried to add emergency capacity and was blocked by regional capacity limits.
If your runbook for a capacity incident says “scale up,” it quietly assumes the capacity exists at the moment you need it. During a regional capacity event, that’s the one assumption most likely to be false, and not just for you. Every customer in the region with an autoscaler is asking for the same resources at the same time.
What did work was step 2: draining traffic from the hottest nodes. That’s load shedding, and its virtue is that it needs no new capacity — it redistributes the capacity you have away from the parts that are melting. Plans that rely on acquiring capacity during an incident are plans that rely on the incident not being about capacity. If your recovery genuinely depends on more machines, they need to be reserved or already running somewhere else before the incident starts.
Two causes, one window
The metadata database issue is easy to skim past. It shouldn’t be. During the same window as the main failure, a separate recent update to a dependency was contributing errors, and was rolled back.
Real incidents look like this far more often than a single-cause narrative suggests. Two things go wrong at once, and the second one either masks the first or makes the mitigation of the first look ineffective. The working lesson for responders: “what changed recently in anything this path touches?” is the first question, not the fifth, and it has to cover dependencies you don’t own. That’s also the most useful job an AI SRE agent can do in the first ten minutes — pulling the change log for every component on the request path and lining it up against the start of impact — because it’s tedious, it’s mechanical, and humans under pressure skip it.
Your detection can’t be their status page
By the preliminary report’s own timeline, impact began at 04:00 Pacific. The first public update on the incident page was posted at 11:24. That’s over seven hours, and IncidentHub’s write-up flagged the same gap.
I don’t read that as a scandal. Status pages lag by design: providers confirm scope before they post, and a partial degradation in one region takes longer to confirm than a hard outage. But it means that if your own alerting is “watch the provider’s status page,” you’d have found out about a write outage in your primary region more than seven hours late.
The downstream picture, as recorded by IncidentHub from the affected vendors’ own notices, shows the alternative. Temporal failed over its multi-region namespaces in us-central1 to replica regions as a precaution. Mixpanel reported ingestion delays for some US projects; Elastic Cloud reported delayed project operations; Torq reported timeouts on some steps. The ones who acted early were working from their own signals and a failover decision made before the day started.
What I’d do this week
Probe your own write path. A tiny synthetic object written and read back every minute, per bucket and region you depend on, with latency and error rate alerting against a seasonal baseline. It costs almost nothing. Write several objects rather than one — this failure was on specific backend nodes, and a single probe object might not land on them — and it would likely have told you within minutes of 04:00 rather than at 11:24.
Decide what writes do when one region returns 503s. Queue locally and drain later? Redirect to a bucket in another region? Fail visibly to the user? Any of those can be right. “Retry until it works” is not, because unbudgeted retries add load to a capacity incident. Retry with backoff, jitter and a budget, and know what happens when the budget runs out.
Know what your bucket’s location type promises. The report names the us-central1 region. It doesn’t say whether dual-region or multi-region buckets with a presence there were affected, so don’t assume they were immune. Find out what your configuration actually guarantees for writes during a single-region event, not just for durability.
Put optimisations through the change process. Same canary, same kill switch, same saturation signals as a feature — with the signals on the receiving side.
Don’t page on status pages. Use them as corroboration once your own probes have fired.
The final root cause analysis will add detail, and it may change the story of the traffic sorting mechanism. I doubt it will change these lessons. An optimisation shipped as a capacity fix, emergency capacity unavailable in a capacity event, and a second cause hiding inside the first: those are worth planning for regardless of what the final report says.
Related: The biggest outages still start with a config change · Cascading Failure: Backpressure, Load Shedding, and Graceful Degradation · A Backup You Have Never Restored Is a Hypothesis
Comments