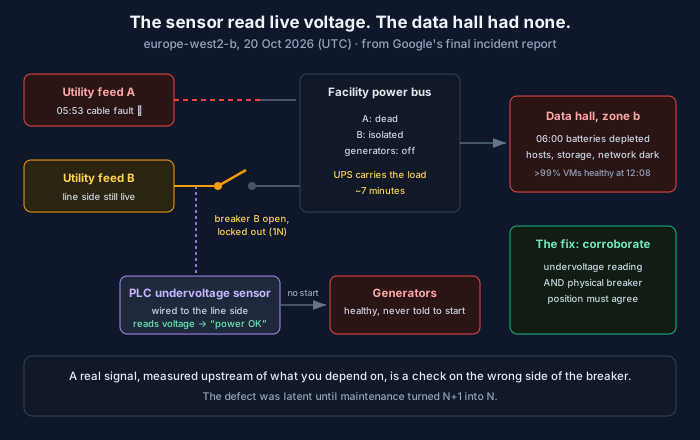
Two weeks ago I wrote about Google’s us-central1 storage incident, where the mitigation turned out to be the outage. Google has now published its final report on a very different failure: on 20 October, the data center hosting europe-west2-b in London lost power, and the zone went dark for most of a working morning.
It’s a physical-infrastructure incident, but almost every lesson in it applies to software systems. The root cause is the one I’ll be quoting for a while.
What happened
All times below are UTC on 20 October, converted from the report’s US/Pacific timeline.
- 05:53 Utility feed A fails because of an external underground cable fault. The generators don’t start. UPS batteries carry the load.
- 06:00 The batteries are depleted. Servers, storage and network hardware in europe-west2-b lose power.
- 06:04–06:08 Monitoring detects the failure.
- 06:09 Failover to the other zones begins. Cross-zone control-plane calls time out, and capacity saturates elsewhere in the region.
- 06:54 Standby utility power is restored to the facility.
- 07:20 Power to the data hall is re-established after the generator controllers are reset and tested.
- 07:40–07:50 Clusters and network devices come back. Storage recovery begins, deliberately held back to avoid worsening unclean-shutdown issues.
- 10:45 Controlled traffic re-admission to europe-west2-b begins.
- 11:11 Platform services and APIs made fully available, though some VMs still weren’t.
- 12:08 More than 99% of Compute Engine VMs healthy.
- 14:03 Closure notice posted.
IncidentHub’s timeline has the first public status update at 08:35, roughly two and a half hours in. It counted twelve downstream outages citing the event, including Revolut, Stripe (Revolut Pay errors), Snowflake, MongoDB and JFrog, and Revolut was still showing problems at 16:00, about two hours after Google’s closure notice.
The root cause: a check on the wrong side of the breaker
The facility had two utility feeds. Feed B was isolated for repairs; the report says the site “had been placed in a temporary single-feed (1N) bridged maintenance posture.” When feed A failed, the generators should have started. They didn’t, and the final report explains why: “the PLC undervoltage sensing inputs were wired upstream (line side) of the isolated utility feed B breaker.”
Feed B’s breaker was open, but the cable on the utility side of it was still live. The controller was measuring voltage at a point that was energized but not connected to anything the data hall used. It saw voltage, concluded power was fine, and didn’t start the generators. Google calls it “a misconfiguration of the PLC logic that did not verify both an undervoltage condition and physical breaker position.”
I keep coming back to this, because every SRE has built this exact check in software.
- A health check that confirms the database process is up, when what the service needs is to commit a write.
- A synthetic probe that hits a cached page and reports green while the origin is down.
- A “replication healthy” metric that measures the replica’s connection to the primary, not how far behind it actually is.
- An alert pipeline that proves the monitor ran, but not that anyone got paged. I wrote about that one last week.
In every case the signal is real, it just comes from upstream of the thing you depend on. It measures that power exists somewhere nearby, not that power reaches your load.
Google’s fix is the general fix: corroborate. Don’t trust one sensor; require the undervoltage reading and the breaker position to agree. In software terms, measure as close to the point of consumption as you can, and where you can’t, require two independent signals before you conclude everything is fine. I made a similar argument about telemetry integrity for agents: a quiet signal and a healthy system aren’t the same thing.
Maintenance quietly turned N+1 into N
The fault in the wiring was latent. With both feeds in service, losing one would have left the other, and nobody would ever have discovered where the sensor was. It only mattered because feed B was out for repairs, which removed one layer of redundancy and left the generator automation as the only remaining one. That last layer had a defect that only showed up in this specific configuration.
That’s a pattern worth naming: the day you’re in maintenance, your redundancy is not what your architecture diagram says it is. You’re running on N, and whatever is left has to be perfect.
Google’s preventative actions reflect that. They include freezing planned maintenance at similar sites, elevated approvals for out-of-standard configuration changes, and generator load-transfer tests with both utility feeds.
The software version happens constantly. A node pool is drained for an upgrade. One replica is down for a rebuild. The DR region is being patched. A zone is cordoned for a kernel rollout. On those days:
- Your capacity math should use the reduced N, and your on-call should know which N you’re on.
- Change policy should tighten. Don’t ship a risky deploy while you’re already running degraded.
- Failover paths that only run in degraded mode should be tested in degraded mode, before the day you need them.
”Multi-zone” degraded too
The comfortable reading of a single-zone outage is that zonal workloads went down and regional ones were fine. The report doesn’t support that.
Zonal resources in europe-west2-b were simply gone: VMs, zonal managed instance groups, zonal GKE clusters, non-HA Cloud SQL, single-cluster Bigtable. The interesting part is what happened to everything else. In Google’s words, “This was not a full regional control-plane outage, but certainly a degraded state.” Cross-zone control-plane calls to the dead zone timed out. Load redirected to zones a and c saturated their capacity. Regional Persistent Disk saw unexpected degradation in zones that still had power. And Cloud SQL, AlloyDB, Memorystore and Bigtable did fail over, but the final report adds: “Some failovers were unsuccessful due to capacity constraints.”
That last sentence should change how you plan. Your N+1 design assumes the surviving zones have room for the lost zone’s load. At the moment a zone disappears, every tenant in the region is failing over into the same two zones at the same time. Autoscaling during a zone loss means competing for capacity with everyone else who made the same assumption.
Here’s the arithmetic, assuming load spreads evenly:
"""What happens to the surviving zones when one disappears.

Assumes load is spread evenly across zones and moves evenly when one is lost.
'scale-up needed' is how much new capacity the survivors need to get back
under the ceiling; that's what you'd be asking the autoscaler for, at the same
moment as every other tenant in the region.
"""
CEILING = 0.80          # utilisation above which latency climbs steeply

print(f"{'zones':>5} {'util now':>9} {'after losing 1':>15} {'scale-up needed':>16}")
for zones in (2, 3, 4):
    for util in (0.40, 0.50, 0.60, 0.70):
        after = util * zones / (zones - 1)
        need = max(0.0, after / CEILING - 1)
        flag = "  over 100%: requests fail" if after > 1 else ""
        print(f"{zones:>5} {util:>9.0%} {after:>15.0%} {need:>15.0%}{flag}")
    print()

# The static-stability question: what's the highest steady-state utilisation
# at which losing a zone needs no new capacity at all?
for zones in (2, 3, 4):
    print(f"{zones} zones: run at or below {CEILING * (zones - 1) / zones:.0%} "
          f"to absorb a zone loss without scaling")
zones util now after losing 1 scale-up needed
2 40% 80% 0%
2 50% 100% 25%
2 60% 120% 50% over 100%: requests fail
2 70% 140% 75% over 100%: requests fail
3 40% 60% 0%
3 50% 75% 0%
3 60% 90% 12%
3 70% 105% 31% over 100%: requests fail
4 40% 53% 0%
4 50% 67% 0%
4 60% 80% 0%
4 70% 93% 17%
2 zones: run at or below 40% to absorb a zone loss without scaling
3 zones: run at or below 53% to absorb a zone loss without scaling
4 zones: run at or below 60% to absorb a zone loss without scalingeurope-west2 has three zones. A service running at a perfectly normal-looking 70% across all three is at 105% the moment one goes away, before anyone else’s failover traffic arrives. To survive a zone loss without needing any new capacity, which AWS calls static stability, you’d run at or below about 53%.
That’s expensive, and it isn’t the right answer for every service. But it’s a decision you should make on purpose, per service, rather than discover during the incident. The queueing theory explains why 80% is already a stretch as a ceiling.
The other half of “multi-zone degraded” is control-plane coupling. If your failover requires calling an API that itself is struggling (creating instances, attaching disks, promoting replicas), it’s the slowest and least reliable part of the recovery. Pre-provisioned standbys and data-plane failover beat control-plane failover, for exactly this reason.
Recovery is slower than failure, on purpose
Power came back to the data hall at 07:20. VMs weren’t broadly healthy until 12:08. The gap isn’t sloppiness. When an entire zone’s storage loses power uncleanly, bringing it back fast is how you turn an availability incident into a data-integrity incident. Google held storage recovery back deliberately, then re-admitted traffic gradually.
It’s worth copying for your own systems. When a zone comes back, the tempting move is to rebalance everything immediately. That’s how you get a second incident: Kafka partition reassignments saturating the network, database replicas all resyncing at once, caches stampeding the origin. Re-admit gradually, verify integrity first, and expect the return to take longer than the failure did.
The first status post took two and a half hours
Google’s own action items include “developing an automated alert-to-communication mechanism for location-impacting incidents.” That’s a candid admission, and it’s worth checking your own setup against it. If your status page update is something a person writes after confirming impact, it’ll lag your detection by a long way. The first post can be automated from the same signal that pages on-call, with something like “We’re investigating elevated errors in region X.” Humans can improve the wording later.
The same goes downstream. Revolut was still impaired two hours after Google’s closure notice. Your customers don’t experience your provider’s recovery time. They experience yours, which includes your own failover, your own backlog drain, and your own caches warming back up.
What I’d check this week
- Find a check that measures upstream of what you depend on. Every system has at least one. Move it closer to the point of consumption, or corroborate it with a second signal.
- Write down your redundancy level during maintenance. What’s N while a node pool drains or a replica rebuilds? What changes are allowed while you’re there?
- Do the zone-loss arithmetic per service. Decide explicitly which services are statically stable and which rely on scaling up during a regional rush.
- Map control-plane dependencies in your failover. Anything that needs an API call to complete is a candidate for pre-provisioning.
- Plan gradual re-admission, and automate the first status page post.
The generators were fine and the batteries did their job. The failure was one sensor wired to the wrong side of a breaker, waiting for the one day both conditions lined up.
Related: The Mitigation Was the Outage: Reading Google’s us-central1 Storage Report Like an SRE · Queueing Theory for SREs: Little’s Law and the Utilisation Knee · Load Balancing and Health Checks: The Three States Your Checks Don’t Have
Comments