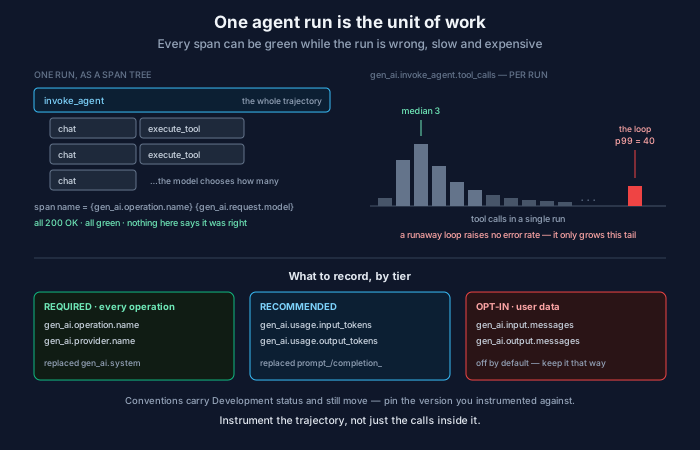
A service request either worked or it didn’t, and thirty years of tooling is built on that. An agent run can return success on every single span it emitted, take forty-one tool calls to do a two-call job, act on a stale belief, and hand you a bill — all while your dashboard stays green. The thing you need to see moved, and the instrumentation had to move with it.
The unit of work changed
For a normal service the unit is the request. Latency, error rate and throughput describe it almost completely, because the work is bounded before it starts: one request, one code path, one answer.
An agent’s unit is the run — a loop where the model proposes an action, something executes it, the result re-enters the context, and the model decides whether to continue. Nothing fixes the length of that loop in advance. The agent chooses it at runtime, based on text it has just read.
That single property breaks the old signals in three specific ways:
- Success is not a status code. Every HTTP call in a run can be 200 while the run does the wrong thing. Correctness is a separate axis your transport layer cannot see.
- Cost is unbounded per unit. Two requests to the same endpoint cost about the same. Two runs of the same agent can differ by an order of magnitude, because one of them looped.
- The interesting number is a count, not a duration. For services you watch how long things took. For agents you also watch how many steps it took, because the failure mode is a loop that never converges.
The span tree
OpenTelemetry’s GenAI semantic conventions give this a shape. The rough anatomy of one run:
invoke_agent  (the whole run)
├── chat        (model decides)
├── execute_tool  (something happens in the world)
├── chat        (model reads the result, decides again)
├── execute_tool
└── chat
Span names follow {gen_ai.operation.name} {gen_ai.request.model} for inference operations — the operation plus the model, so chat gpt-5 rather than a free-text label. Retrieval spans name the data source instead, and fetch_response uses the operation name alone, because response identifiers are high-cardinality and would shred your index.
Two attributes are required on every GenAI operation: gen_ai.operation.name and gen_ai.provider.name. The operation values are an enumerated set, and reading the list tells you how much of an agent’s behaviour the spec now expects to see — chat, generate_content, text_completion, embeddings, retrieval, fetch_response, execute_tool, create_agent, invoke_agent, invoke_workflow, plan, and a family of memory operations from create_memory through search_memory to delete_memory_store.
Conditionally required: error.type when the operation fails, gen_ai.request.model when it is available, and gen_ai.conversation.id. Recommended: gen_ai.usage.input_tokens, gen_ai.usage.output_tokens, gen_ai.response.model and server.address. Tool spans carry gen_ai.tool.name and gen_ai.tool.call.id; agent spans carry gen_ai.agent.name and gen_ai.agent.id.
Two renames that will silently break your dashboards
If you instrumented before this summer, check two things. gen_ai.system has been replaced by gen_ai.provider.name. And the token attributes gen_ai.usage.prompt_tokens and gen_ai.usage.completion_tokens have been replaced by gen_ai.usage.input_tokens and gen_ai.usage.output_tokens.
Neither rename throws an error anywhere. Your panels keep rendering; they just quietly stop matching new data, and a cost dashboard that silently reads zero is worse than one that breaks loudly. The conventions have also moved into a dedicated OpenTelemetry GenAI repository, so older spec URLs now land on deprecated copies — worth re-checking any links in your runbooks.
One more thing worth saying plainly: these conventions carry Development status. They are the right thing to adopt, and the names will still move. Pin the version you instrumented against and treat a convention bump as a change with a migration, not a dependency bump. I walked the earlier shape of this taxonomy in tracing the agent loop; this is what it looks like after the move.
The metrics that only make sense for agents
Most GenAI metrics are ordinary latency histograms: gen_ai.client.operation.duration, gen_ai.server.request.duration, plus streaming-specific ones like gen_ai.client.operation.time_to_first_chunk and gen_ai.server.time_to_first_token. Useful, familiar, nothing new to learn.
Three are different, and they are the ones I would put on the wall:
gen_ai.invoke_agent.tool_calls— a histogram, in units of{tool_call}, of how many tools a single run invoked.gen_ai.invoke_agent.inference_calls— the same for model calls, in{inference_call}.gen_ai.invoke_agent.duration— how long whole runs take, not individual calls.
These are per-run distributions, and that is exactly the point. A runaway loop does not raise your error rate — every call in it succeeds. It shows up as a tail in the tool-call distribution: a p99 of forty when the median is three. That tail is the signal that a run stopped converging, and it is invisible to every dashboard built around request success.
Watch them as distributions, never as averages. A mean tool-call count sits comfortably near the median while the expensive minority hides in the tail, and the tail is the part that costs money and takes actions.
gen_ai.execute_tool.duration rounds this out, carrying gen_ai.tool.name as a required attribute — which is how you find the one slow tool that makes every run using it drag.
Content capture is a privacy decision, not a verbosity setting
The conventions mark message content as opt-in: gen_ai.input.messages, gen_ai.output.messages, gen_ai.system_instructions and gen_ai.tool.definitions are all off unless you deliberately enable them.
Respect that default. Those fields carry whatever your users typed — including the credentials people paste into chat boxes, and regulated data they had no business sending. Turning them on globally moves that material into a tracing backend that is almost certainly not scoped, retained or access-controlled for it, and your observability vendor’s retention policy becomes a data-protection decision nobody reviewed.
The workable middle: metadata always, content sampled. Token counts, tool names, durations and outcomes on every run; full messages for a small sampled fraction, in environments where the data is synthetic or consent is explicit. You need a handful of complete traces to debug; you do not need all of them.
What traces still won’t tell you
Three questions survive perfect instrumentation, and it is worth knowing which ones so you do not go looking for them on a dashboard.
Was the action correct? A span says a tool ran and returned. It cannot say the remediation addressed the real condition. Deciding that is an adjudication step, automated where outcomes are machine-checkable and human otherwise — and its latency is itself a reliability property, because a verdict that arrives a week late governs nothing. I measured that coupling in Error Budgets for Autonomy: each hour of adjudication lag is an hour of detection latency, essentially one-for-one.
How much authority should this agent have tomorrow? That is a longitudinal question about a track record, not a point-in-time one about a span.
Is the loop stable? An agent that acts, waits, and acts again before the first action has landed is a control loop with dead time, and it oscillates for reasons no single trace shows. That is the subject of Stable by Design.
And one hazard that is pure instrumentation: your telemetry can be wrong rather than missing. A collector that has quietly died looks exactly like a quiet system, and an agent that cannot tell those apart will confidently act on the difference — which is the argument in telemetry integrity and trust-calibrated autonomy.
What to do this week
- Grep for the old attribute names.
gen_ai.system,prompt_tokens,completion_tokens. Fix the dashboards before they read zero. - Put the per-run distributions on a board. Tool calls and inference calls per run, at p50 and p99. You are looking for the gap between them.
- Check your content-capture setting. If
gen_ai.input.messagesis on in production, decide that deliberately or turn it off. - Alert on the tail, not the mean. A run taking 10× the median number of tool calls is the loop you want to hear about while it is still running.
The rule worth remembering
When the system decides its own next step, the run is the unit of work — so instrument the trajectory, not just the calls inside it. Every span can be green while the run is wrong, slow and expensive. Count the steps, watch the tail of that count, keep content capture opt-in, and remember that traces tell you what happened and never whether it should have.
Comments