In observability for AI systems I made the conceptual argument: when your service calls an LLM, the golden signals stop covering the failures that page you, and context — what the model was actually given and what it did with it — becomes a first-class telemetry object. Several people asked the obvious follow-up: fine, but what do I actually emit?
Since then the answer has firmed up considerably. OpenTelemetry’s GenAI semantic conventions have grown from “a draft about chat completions” into a vocabulary that covers model calls, agent operations, tool execution, and — as of v1.39 — MCP itself. This post is the practitioner’s read: what the conventions give you, where the sharp edges are, and how to adopt them without betting your dashboards on attribute names that may still change.
Your agent is a distributed system. Instrument it like one.
Strip the novelty away and an agent task is a call graph: an orchestrating loop that fans out to model invocations, tool executions, sub-agent calls, and external services, with failures and latency at every hop. We know exactly one good tool for debugging call graphs in production, and it’s distributed tracing.
What tracing buys you for agents specifically:
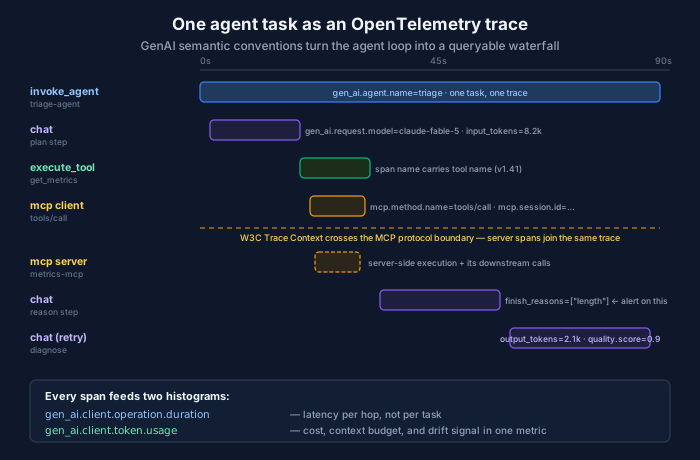
- The loop becomes visible. An agent that “took 90 seconds” decomposes into four model calls, two tool executions, and one retry storm. You can’t fix the aggregate; you can fix the hop.
- Cost gets attributed. Token usage recorded per span rolls up to cost per task, per agent, per tenant — the raw material for any token-budget governance you want to run.
- Incidents get a timeline. When an agent does something wrong, the trace is the flight recorder: what it was asked, what it saw, what it called, in what order. Your postmortem stops depending on scrollback.
The reason to use the standard vocabulary instead of your own attribute names is boring and decisive: portability. Datadog, New Relic, Honeycomb and others now ingest the GenAI conventions natively, and the major agent frameworks emit them. Name things gen_ai.usage.input_tokens and the ecosystem works for you; name them myco.tokens_in and you maintain the translation layer forever.
The span taxonomy, in the order you’ll meet it
Client spans wrap each model invocation — operations like chat or generate_content. The attributes you’ll actually query: gen_ai.provider.name, gen_ai.request.model and gen_ai.response.model (not always the same thing — routing and silent upgrades live in that gap), gen_ai.usage.input_tokens / gen_ai.usage.output_tokens, and gen_ai.response.finish_reasons. That last one deserves an alert: a rising rate of length finish reasons means truncated outputs — the quiet failure mode behind malformed tool calls and half-written remediation plans.
Agent spans structure the loop itself: invoke_agent for a full agent invocation, execute_tool for each tool call, invoke_workflow for predetermined multi-step paths, create_agent for dynamic instantiation. Nested properly, they turn the flat sequence of model calls into a tree that mirrors how you think about the task — and they’re what makes “which tool call blew the latency budget” a query instead of an investigation.
MCP spans close the gap that used to hurt most. Before v1.39, traces died at the protocol boundary: the agent said “called the tool,” the MCP server said nothing, and you correlated timestamps by hand. Now the client side emits mcp.method.name, mcp.session.id, and mcp.protocol.version, and W3C Trace Context rides across the wire so server-side spans join the same trace. If you run an MCP gateway, this is where it earns its observability keep: one choke point that stamps identity, session, and trace context onto every tool call in the fleet.
Metrics come down to two client histograms — gen_ai.client.operation.duration and gen_ai.client.token.usage. Provider extensions add cache-read token counts, which matter directly for your prompt caching hit rate, and reasoning-token counts, which matter for anyone paying for extended thinking.
What the spec doesn’t solve for you
The conventions are a vocabulary, not a strategy. Three decisions stay on your desk.
Content capture is a policy question wearing a config flag. The conventions define how to record prompt and completion content on events, but whether to record it is about PII, secrets in context windows, and your retention story. My working rule: capture full content in dev and staging always; in production, capture it for sampled traces and for every trace that ends in an error or a low quality score. An agent trace without content answers “how slow”; only content answers “how wrong” — and as I argued before, wrong is the failure mode that matters.
Cardinality will find you. Agent workloads generate attribute values with user-sized cardinality — session IDs, tool argument fragments, per-task identifiers. Keep high-cardinality values on spans (where they belong) and out of metric dimensions, or your token-usage histogram becomes its own cost incident. The line between “rich trace” and “cardinality bomb” is one careless attribute.
Quality signals still aren’t standard. The conventions tell you how the loop executed, not whether the answer was any good. Evaluation results — grader scores, guardrail verdicts, human feedback — currently ride as custom attributes or span events. The GenAI SIG is working on evaluation and multi-agent conventions, but today this is the part you design yourself. Design it anyway: a trace that ends in quality.score=0.2 is the search key for every debugging session that matters.
And the stability caveat, stated plainly: the GenAI and MCP conventions are in Development status as of v1.41.0 (May 2026). Names have changed before and may again. The mitigation isn’t avoidance, it’s architecture — emit gen_ai.* attributes from one instrumentation module you own, not from application code in forty places. Centralized emission turns a spec rename into a one-PR migration, with OTEL_SEMCONV_STABILITY_OPT_IN controlling the cutover.
What to do Monday
- Turn on what your framework already emits. LangChain, CrewAI, and friends ship OTel instrumentation; most teams just haven’t wired the exporter. One environment variable may buy you the whole waterfall.
- Wrap model and tool calls in one place. A thin internal client that emits client spans,
execute_toolspans, and the two metrics. That module is your blast-radius container for spec drift. - Propagate context across MCP. If you run a gateway, add trace-context propagation there first — every server behind it joins the trace for free.
- Alert on finish reasons and token drift.
lengthfinish-reason rate and tokens-per-task by agent are the two cheapest early-warning signals in the whole stack. - Record quality as a span attribute now, even though it’s non-standard. You can rename an attribute later; you can’t retroactively score last month’s traces.
The 2026 reality is that the AI-native SRE stack is being assembled while we operate it, and observability is the layer where the standards have moved fastest. The conventions aren’t finished. Neither are your agents. Instrument them anyway — a Development-status trace beats a production-status mystery every time I’ve had to choose.
Comments